
Rebate Analytics: Reporting, Dashboards & Opportunity Analysis
What rebate analytics should deliver — real-time accrual dashboards, liability forecasting, scheme profitability and partner performance analysis.
In short
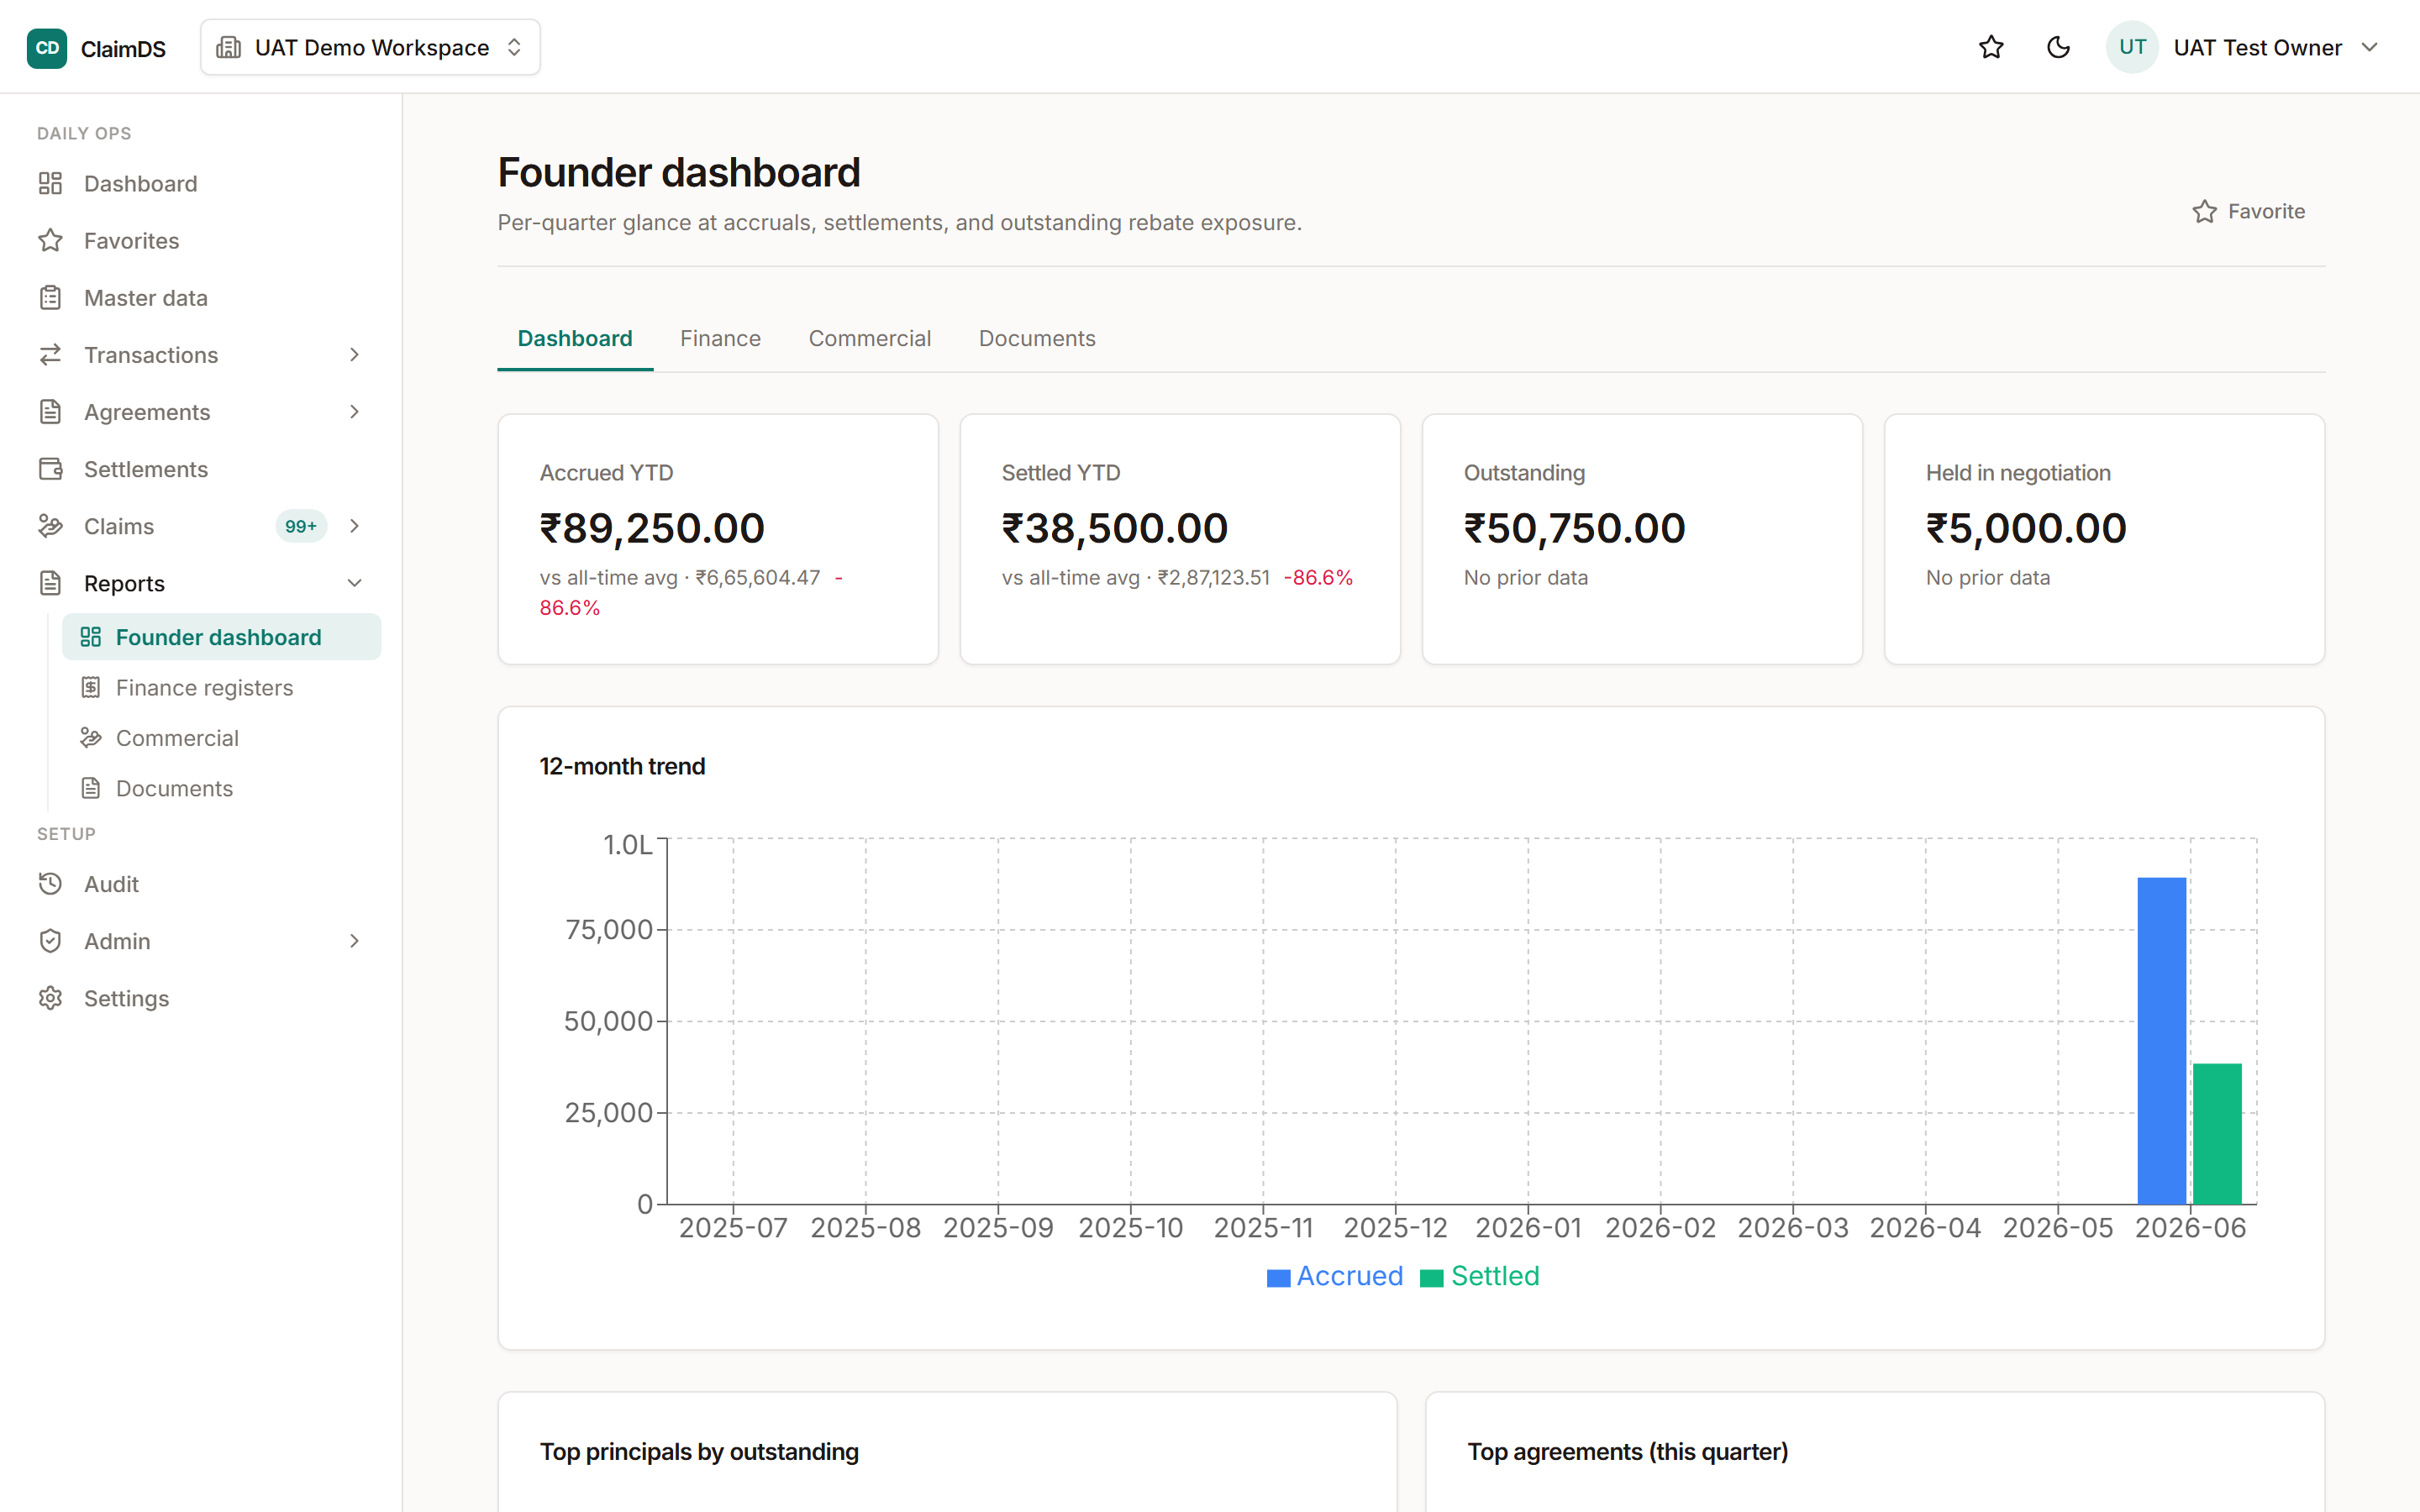
Rebate analytics is the reporting layer over a rebate program: real-time accrual dashboards, liability forecasting, scheme profitability, partner performance versus targets, slab-proximity and what-if analysis. It turns scheme data into decisions — which is impossible while that data lives in disconnected spreadsheets.
Rebate analytics is the reporting layer over a rebate program: real-time accrual dashboards, liability forecasting, scheme profitability, partner performance versus targets, slab-proximity, and what-if opportunity analysis. It turns scheme data into decisions — which is impossible while that data lives in disconnected spreadsheets.
What rebate analytics should deliver
| Insight | The question it answers |
|---|---|
| Real-time accrual dashboard | "What do we owe across every scheme right now?" |
| Liability forecast | "Where will scheme cost land at period-end?" |
| Scheme profitability | "Which schemes pay back, which don't?" |
| Partner performance | "Who's beating target, who's lagging?" |
| Slab-proximity | "Who's one nudge from the next tier?" |
| What-if / opportunity | "What does this scheme cost at 3 volumes?" |
This is the analytics view of the rebate management software pillar, built on the live accrual in rebate tracking software.
Why spreadsheets can't do it
Analytics needs one connected, live dataset. When schemes sit in one file, sales in another and settlements in a third, the numbers have already drifted before anyone charts them. A live accrual — schemes, sales and settlements reconciled together — is the prerequisite for any trustworthy analysis. This is the same disconnect behind revenue leakage in rebate programs and the reporting-quality argument in the CFO revenue-leakage playbook.
From dashboards to decisions
The point of analytics is action, not charts. Slab-proximity turns a report into revenue: flag partners close to the next tier and let sales chase the volume that unlocks it. Scheme profitability lets finance retire schemes that don't pay back — the method is in the claims management ROI benchmark. What-if simulation tests a scheme's cost before you fund it. The scheme mechanics behind the numbers are in volume rebates.
What should a liability dashboard actually show?
The centrepiece of the analytics stack for channel programs is the accrued-versus-settled view — one screen that answers "what do we owe, what have we already paid, and how old is the difference?" Built properly, it has three layers:
- Accrued liability — the live total across every open scheme, computed from actual sales rather than a quarter-end estimate. The computation discipline behind this number is the one in calculating supplier rebate accruals.
- Settled against accrual — how much of that liability has already been claimed, validated and settled by credit note.
- The open gap, aged — what remains, bucketed by how long it has been outstanding (0–30, 31–60, 61–90, 90+ days), cut by scheme, partner and region.
An illustrative read: a distributor network accrues ₹4.2 crore across its Q2 schemes; ₹2.9 crore has settled; ₹1.3 crore is open, of which ₹38 lakh is more than 90 days old. That ₹38 lakh is the number to interrogate. It is one of three things — unclaimed partner money (a relationship problem), claims stuck in validation (a process problem), or over-accrual that should be released (a reporting problem). Without the aging cut, all three look identical, and finance carries a liability it cannot explain.
What does an attainment distribution tell you?
For slab and target schemes, plot every partner's attainment against the scheme's tier boundaries. The shape of that distribution is a verdict on scheme design:
- Clustering just below a boundary — partners sitting at 96–99% of a slab threshold are the slab-proximity opportunity: a targeted nudge in the closing weeks converts them, profitably for both sides.
- Clustering far below every tier — the targets were set above what the channel can realistically reach; the scheme is burning goodwill without buying volume.
- Everyone comfortably in the top tier — the scheme paid for volume that would have happened anyway; the thresholds were set too low.
One distribution chart per scheme, refreshed weekly during the window, replaces a quarter of anecdote-driven argument between sales and finance. The design grammar behind these mechanics is in types of trade schemes in India.
How do you spot leakage and unprofitable schemes?
Three families of views turn the same accrual data into margin protection:
- Leakage indicators. Unclaimed-accrual aging (money partners earned but never claimed — which resurfaces later as disputes), settlement-versus-entitlement variance (payouts that drifted above what the rules compute), and duplicate-pattern flags (the same invoices or period claimed twice). Each is a standing dashboard tile, not a year-end forensic project.
- Scheme-ROI views. Payout per scheme against the incremental volume or margin it generated, so finance compares schemes like-for-like and retires the ones that never pay back.
- Partner-level profitability. Total scheme spend as a percentage of each partner's turnover, against the margin that partner generates. Illustratively: two dealers each billing ₹1.8 crore a quarter, one absorbing 5.4% of turnover in scheme payouts and the other 2.3% — same revenue, very different account economics. That comparison is invisible when scheme spend sits in scattered files.
The metric → question → decision table
| Metric | The question it answers | The decision it drives |
|---|---|---|
| Accrued vs settled gap, aged | "How much liability is open, and how stale?" | Chase claims, unblock validation, or release over-accrual |
| Attainment distribution | "Is the scheme designed at the right thresholds?" | Nudge near-tier partners; redesign next window's slabs |
| Unclaimed-accrual % | "How much earned money never got claimed?" | Prompt partners before disputes form |
| Settlement vs entitlement variance | "Are we paying above what the rules compute?" | Tighten validation; investigate exceptions |
| Scheme ROI | "Which schemes pay back?" | Fund, redesign or retire per scheme |
| Partner scheme-spend % of turnover | "Which accounts are we over-investing in?" | Rebalance scheme participation per partner |
What data does rebate analytics need?
Analytics is only as good as the dataset underneath it, and for channel programs that means four feeds reconciled together:
- The scheme master — rules, slabs, windows and eligibility, versioned so the analytics reads the rule that actually applied.
- Sales at the right tier — primary billing from the ERP, plus secondary and tertiary movement from the channel. Sell-through schemes analysed on sell-in data produce confident, wrong answers; the distinction is unpacked in primary vs secondary vs tertiary sales, and the plumbing that keeps the ERP feed live is covered in ERP integration for claims and rebate software.
- Claim and settlement records — statuses, values and timestamps, so accrued-versus-settled is computable at all. The operational flow behind them is secondary scheme settlement.
- The credit-note ledger — the settled truth the whole stack reconciles to, which is also what makes the numbers safe to hand to financial reporting.
Where does what-if simulation fit?
Everything above looks backward or sideways; what-if is the forward-looking arm of the same stack. Once accrual and settlement data are clean, you can simulate a proposed scheme's cost at three volume scenarios before funding it — and compare the projected payout curve against what comparable past schemes actually returned. The full treatment of simulation, baseline-versus-lift measurement and liability forecasting is in how TPM software improves forecasting and promotion ROI. Feeding those projections back into the scheme budget — how it is allocated, tracked and utilized — is covered in trade promotion scheme budgeting.
Where RebateLedger fits
RebateLedger surfaces these insights from the same live accrual it settles on — accrual dashboards, scheme profitability, partner performance and slab-proximity — India-first, at a mid-market price (a RebateLedger-supplied ~₹3–5 lakh/yr figure, positioning not a benchmark). It sits alongside the core features checklist and the positioning in why RebateLedger.
Frequently asked questions
What is rebate analytics?
Rebate analytics is the reporting layer over a rebate program — real-time accrual dashboards, liability forecasting, scheme profitability, partner performance versus targets, slab-proximity ("who's close to the next tier"), and what-if opportunity analysis. It turns raw scheme data into decisions finance and sales can act on.
Why can't you do rebate analytics on spreadsheets?
Analytics needs one connected dataset — schemes, sales and settlements reconciled together and updated live. Disconnected spreadsheets can't keep a single accurate accrual across many schemes and partners, so any "analysis" on top is built on numbers that already drifted out of date.
What is slab-proximity analysis?
Slab-proximity analysis flags partners who are close to crossing into the next rebate tier, so sales can nudge the extra volume that unlocks it — a profitable, targeted action that is invisible without a live accrual per partner per scheme.
What should a rebate liability dashboard show?
Three layers: total accrued liability across every open scheme, the portion already settled against it, and the open gap aged by how long it has been outstanding — cut by scheme, partner and region. The accrued-versus-settled gap is the most decision-rich number, because a widening gap means claims are not settling at the pace liability is building.
What data does rebate analytics need?
Four connected datasets: the scheme master (rules, slabs, windows), sales data at the right tier (primary from the ERP, secondary and tertiary from the channel), claim and settlement records, and the credit-note ledger. If any one is missing or stale, every metric downstream of it is decoration.
How does rebate analytics reduce revenue leakage?
Leakage hides in gaps — accruals never claimed, settlements above entitlement, duplicate payouts. Analytics turns each gap into a standing indicator (unclaimed-accrual aging, settlement-versus-entitlement variance, duplicate-pattern flags), so the operations team fixes the leak in-cycle instead of discovering it at year-end.
Who should own rebate analytics in an Indian manufacturing company?
Anchor it in sales finance or commercial finance, with defined roles around it: sales operations owns scheme design inputs and partner data, the tax team owns settlement classification and withholding monitoring, and IT owns the data pipeline. In mid-sized companies this is often one or two people, which is why standardised dashboards matter more than headcount. The critical failure mode is nobody owning it — schemes then run for years unmeasured.
How can rebate data be used to segment distributors?
Rebate data reveals behaviour billing alone cannot: claim discipline, scheme responsiveness (whose volumes genuinely move with incentives), achievement patterns that suggest loading, and dispute propensity. Combined with size and growth, these produce actionable segments — responsive, disciplined partners who merit richer incentives and fast-track settlement; large-but-unresponsive partners where spend should shift to execution-linked payouts; high-dispute partners needing format intervention. Review segment migration yearly.
See RebateLedger on your own claims data
A 30-minute walkthrough tailored to how your channel actually settles claims.